Outreach and Engagement at Michigan State University, 2012
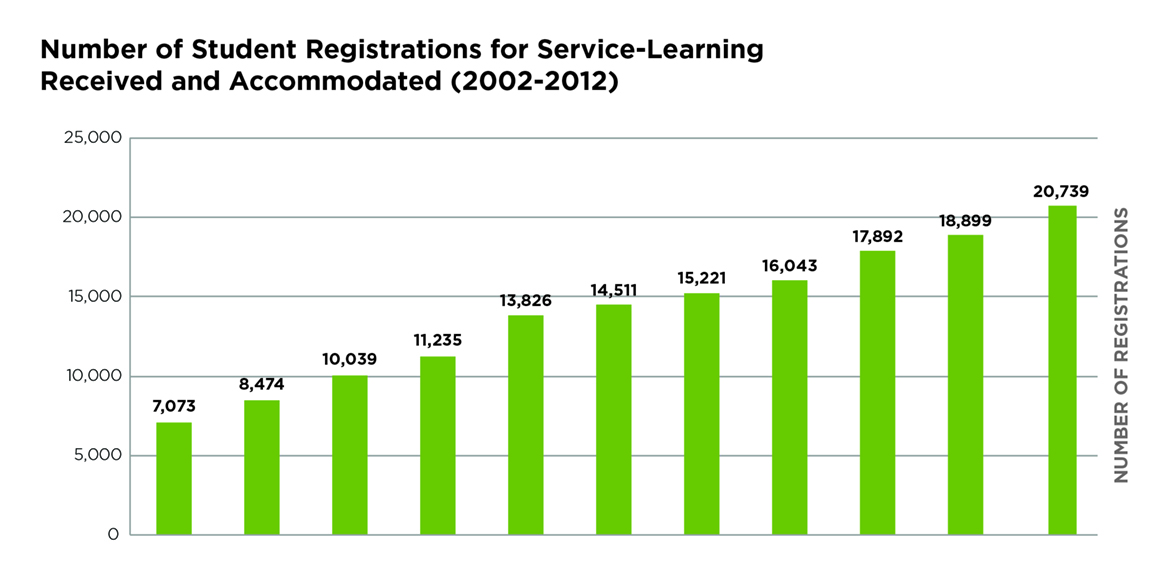
Sponsored by MSU's National Collaborative for the Study of University Engagement (NCSUE), the Outreach and Engagement Measurement Instrument (OEMI) gathers data about the outreach activities of MSU faculty and academic staff. The information is self-reported and participation in the annual survey is voluntary. Data for 2012 were collected between January and April 2013 and represent the ninth year of data collection; 568 faculty and academic staff responded to the survey. Since 2004, 3,104 distinct (non-duplicative) respondents have reported their outreach and engagement through the OEMI. For this snapshot, OEMI data are augmented with data from the service-learning and civic engagement student registration system.
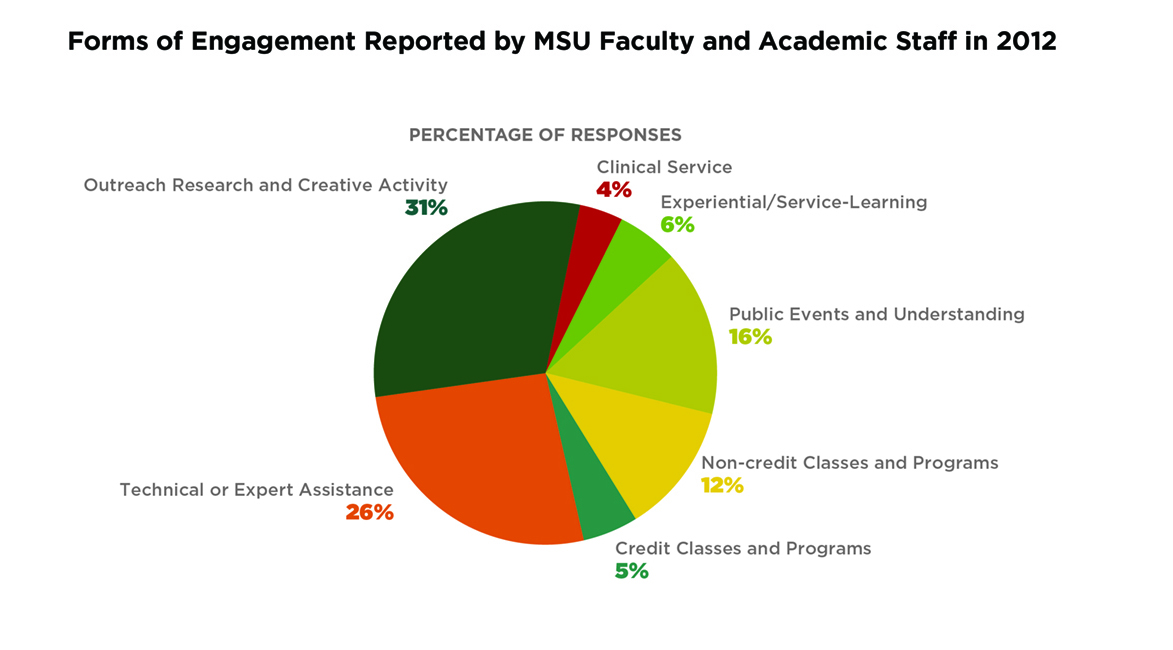
OEMI results for 2012 include the following:
$11,347,469
Value of salary investment by MSU faculty and academic staff in addressing issues of public concern (data from those reporting outreach activities on the OEMI)
95.9%
Respondents whose outreach contributed to achieving Boldness by Design (BBD) imperatives:
75.1% = Enhanced the student experience
78.0% = Enriched community, economic, and family life
43.4% = Expanded international reach
63.7% = Increased research opportunities
56.1% = Strengthened stewardship
448
Number of specific projects/activities reported
Of the respondents who described specific projects/activities:
84.4% = Reported working with external partners
83.3% = Reported having created intellectual property and scholarly outcomes
80.5% = Reported that their outreach work impacted their scholarly or teaching practices
* The number of "responses" is greater than the number of "respondents." Respondents were given the opportunity to describe their engagement activities for up to two areas of social concern; each description was counted as a separate response.
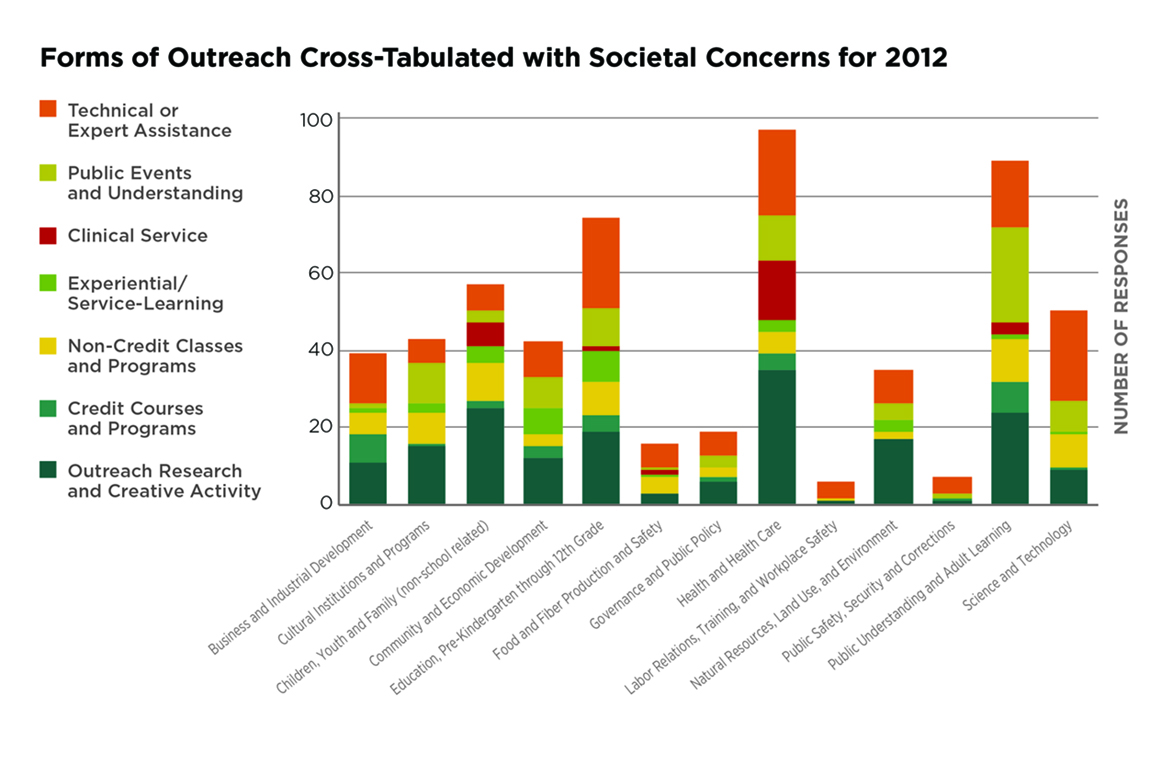
* The number of "responses" is greater than the number of "respondents." Respondents were given the opportunity to describe their engagement activities for up to two areas of social concern; each description was counted as a separate response.